
A Quick Debate about Sample Size Determination

Photo by Chokniti Khongchum on Pexels.com
Is more data better or worse?
Abstract
One quantitative challenge facing experimenters in data science is how large a sample size is required to properly analyze data by a neural network. This article briefly explores the two opposing sides of the argument and how they each approach the question of sample size determination. While the classic approach of more data is better, modern statisticians such as Douglas Hubbard offer a contemporary method applying the concept of the Rule of Five. While this approach may seem counter-intuitive, it is based upon sound mathematical and statistical calculations. It does not significantly diverge from classic considerations of sample size selection. The findings, while seemingly different, are neither problematic nor formidable for whichever methodology is selected by the academic researcher.
The challenge of estimating the sample size to train an Artificial Neural Network (ANN) is one primary quantitative concern for cybersecurity defense measures (Abbott, 2014; Loy, 2019). Historically, the consideration for good sampling has been the more extensive the sample size, the better its ability to support data-based predictions (Adams & Lawrence, 2019; Wahba, El Salamouny, & El Taweel, 2017). However, new considerations have also recognized smaller samples can be just as predictive in determining sample sizes needed for practical data analysis (Aase, 2014; Hubbard, 2009; Hubbard & Seiersen, 2016). This article briefly discusses the two major factions of sample size selection approaches that are not vastly apart in their respective considerations.
The Rule of Five
Aase (2014) highlights that the Rule of Five affords a “significantly improved confidence interval” when considering the size of any sample drawn from a representative population” (para. 2). The rule states that “a randomly drawn sample [from a population] of five elements will have a 93.75% chance of containing the true median [value] of a population” (para. 5). In other words, five samples from a varied and randomized representative population have a near 94% Confidence Interval (CI) of representing the actual data. This sample size methodology could also be applied for cyber-threat identification by neural network-based automated solutions. Lastly, Hubbard and Seiersen’s (2016) foundational work would further suggest that if properly and randomly selected from a given population, five threat audit log captures are sufficient to be statistically significant for that population.
However, Rodriguez and Da Cunha’s (2018) examination of Big Data advises the strengths of Big Data, specifically creating an environment where more extensive population numbers provide better predictive outcomes (Adams & Lawrence, 2019). Larger data affords a higher sample size that theoretically will more likely increase the capabilities of data science methods to include an ANN.
Furthermore, Tavernier, Trinquart, and Giraudeau (2016) offer that samples must be individually randomized and power calculations applied to determine minimum sample size requirements. “Established practice requires investigators to calculate the sample size based on [a] power calculation” (p. 1). Power calculations form the basis of establishing nominal sample sizes for any trial or experiment.
Power Calculations
As Adams and Lawrence (2019) describe, “minimum sample size [determination is] required for [study] results to represent the population” (p. 120). The difficulty is the large sample size needed to ensure a good experiment that avoids undue error and bias. Determining the required number of audit or system log entry files to use with a neural network involves the determination of a sufficient sample size.
Available sample size calculators can be used and are readily available on the Internet based on established statistical norms (Adam & Lawrence, 2019). The experimenter must determine two contextual factors using the selected power calculator (“Calculator.net,” 2020); the researcher must understand and resolve these considerations thoroughly. The first is population proportion, which describes a percentage of a population where “there is an equal chance of the measured value being either higher or lower than the true value” (“Calculator.net,” 2020). For a neural network, an amount of 50% would be used. (Since this is a binary analysis, there is a 50% chance that the neural network will determine the log entry event as either a threat [1] or a non-threat [0]). The second factor required is the population size, which is the total grouping “that [the] researcher is interested in examining defined by specific characteristics” (Adams, & Lawrence, 2019, p. 112). Since the population size is considered very large, the population is assumed to be unlimited.
Finally, based upon a standard 95% CI and margin of error of 5%, the sample size needed would require 385 samples (Adams & Lawrence, 2019). While the power calculation of 385 is 77 times larger than the Rule of Five suggests, the differences are undoubtedly manageable for most researchers, see Figure 1. The researcher can select and cope with the needed training of data between the upper and lower values discussed in this discussion.
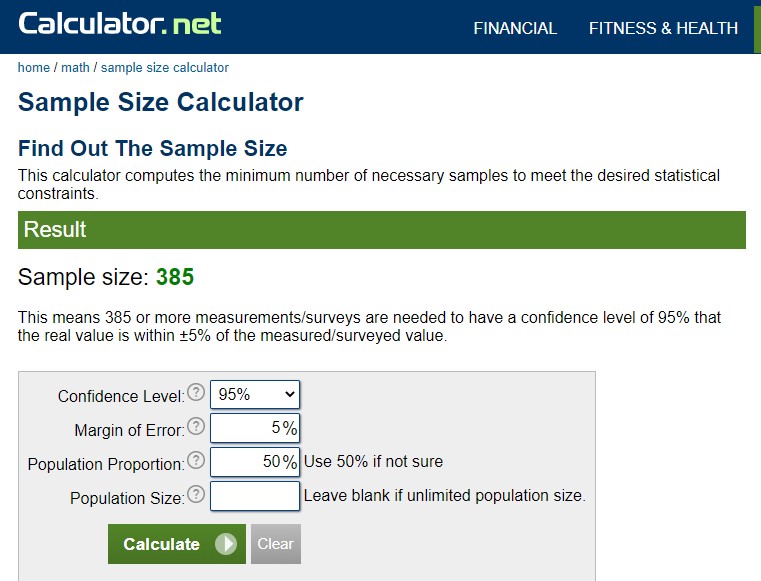
Figure 1. Sample Size Calculator. Calculated from source:Calculator.net. (2020). Retrieved July 2, 2020, from Calculator.net website: https://www.calculator.net/sample-size-calculator.html?type=1&cl=95&ci=5&pp=50&ps=&x=51&y=14
Conclusion
For example, a randomized selection of five through 385 audit log entries would likely provide enough data sample size to meet a neural network experiment. Other considerations would include recognition of underfitting and overfitting concerns and varied sampling approaches such as random and stratified data collection. Foody (2017) identifies explicitly that stratified sampling is not a good selection for ANNs and requires the experimenter to understand the strengths and weaknesses of any method and associated tools. Finally, the quantification of data sampling still challenges the classic and emerging standards, as Hubbard and Seiersen (2016) suggested. However, both sides of the argument are not widely divergent; indeed, either sampling choice affords flexible means for whichever data sampling approach is selected.
References
Aase, L. (2014, October 19). Measurement and the rule of 5 [Blog post]. Mayo Clinic. Retrieved from https://socialmedia.mayoclinic.org/2014/10/19/bus-122-measurement-and-the-rule-of-5/
Abbott, D. (2014). Applied predictive analytics: Principles and techniques for the professional data analyst. Indianapolis, IN: John Wiley & Sons.
Calculator.net. (2020). Retrieved July 2, 2020, from Calculator.net website: https://www.calculator.net/sample-size-calculator.html?type=1&cl=95&ci=5&pp=50&ps=&x=51&y=14
Foody, G. M. (2017). Impacts of sample design for validation data on the accuracy of feedforward neural network classification. Applied Sciences, 7(9), 888. Retrieved from doi:http://franklin.captechu.edu:2123/10.3390/app7090888
Hubbard, D. (2009, February 11). I am concerned about the CI, median and normal distribution [Blog post]. Hubbard Decision Research. Retrieved from https://hubbardresearch.com/i-am-concerned-about-the-ci-median-and-normal-distribution/
Hubbard, D., & Seiersen, R. (2016). How to measure anything in cybersecurity risk. Hoboken, NJ: John Wiley & Sons.
Loy, J. (2019). Neural network projects with Python. Birmingham, UK: Packt.
Rodriguez, L., & Da Cunha, C. (2018). Impacts of big data analytics and absorptive capacity on sustainable supply chain innovation: A conceptual framework. LogForum, 14(2), 151–161. Retrieved from doi:http://franklin.captechu.edu:2123/10.17270/J.LOG.267
Tavernier, E., Trinquart, L., & Giraudeau, B. (2016). Finding alternatives to the dogma of power based sample size calculation: Is a fixed sample size prospective meta-experiment a potential alternative? PLoS One, 11(6). Retrieved from doi:http://franklin.captechu.edu:2123/10.1371/journal.pone.0158604
Wahba, Y., El Salamouny, E., & El Taweel, G. (2017). Estimating the sample size for training intrusion detection systems. International Journal of Computer Network and Information Security, 11(12), 1. Retrieved from doi:http://franklin.captechu.edu:2123/10.5815/ijcnis.2017.12.01

Dr. Russo is currently the Senior Data Scientist with Cybersenetinel AI in Washington, DC. He is a former Senior Information Security Engineer within the Department of Defense’s (DOD) F-35 Joint Strike Fighter program. He has an extensive background in cybersecurity and is an expert in the Risk Management Framework (RMF) and DOD Instruction 8510, which implement RMF throughout the DOD and the federal government. He holds a Certified Information Systems Security Professional (CISSP) certification and a CISSP in information security architecture (ISSAP). He has a 2017 Chief Information Security Officer (CISO) certification from the National Defense University, Washington, DC. Dr. Russo retired from the US Army Reserves in 2012 as a Senior Intelligence Officer.